Reporting across your practice
See fees, clients, pipeline and billing in one place, inside Socket.
The Insights dashboard turns your proposals and billing plans into live reporting: recurring revenue, revenue by service, pipeline, win rate and what you'll bill next. No spreadsheets, and no month-end scramble.




Stop rebuilding the numbers every month
The regular drill was exporting data and rebuilding charts just to compare this month with last. Socket already holds the proposals you've sent and the billing that follows, so the Insights dashboard does that work for you.
Insights shows you how your recurring revenue is moving, which services carry the practice, and where the pipeline stands, on demand and filtered by client owner, client manager, proposal owner or service.
Your whole practice at a glance
Get the numbers that matter for the whole practice or your own portfolio.
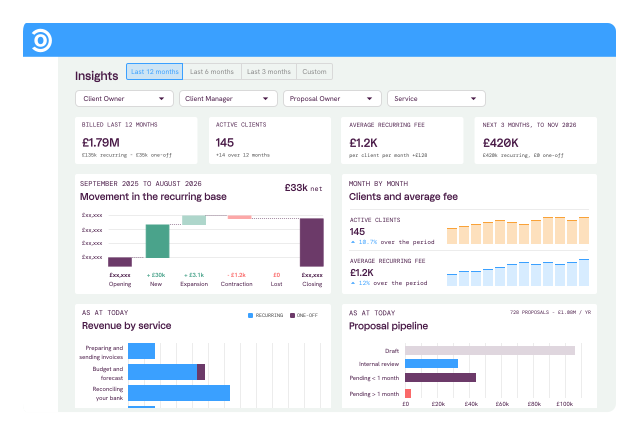
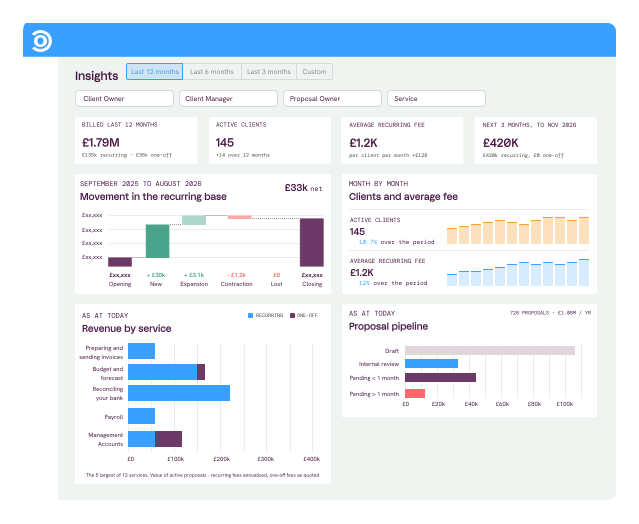
- →Total billing, active clients, average recurring fee and the next three months of billing, side by side.
- →Watch active clients and average fee month by month, so you spot a growing book or a slipping fee early.
- →Filter by client owner, client manager, proposal owner or service, over any period from last month to a custom range.
See exactly how your recurring revenue moved
Know where growth came from and where it's leaking, without reconciling invoice exports.
- →Follow the recurring base through new, expansion, contraction and lost revenue.
- →Figures come from contracted monthly billing plans, not invoices, so a late invoice never distorts the picture.
- →Track billing month by month, with the next three months projected so you can forecast what is coming in.
Know which services earn their keep
Compare what each service is worth across the practice, using the proposals your clients have actually agreed.
- →Break down active proposal value by service, with recurring and one-off work shown side by side.
- →Recurring fees are annualised and one-off fees shown as quoted, so every service is measured with the same yardstick.
- →Feed what you learn back into your pricing and keep fees in step with Price Monitoring.
Keep the pipeline moving and the win rate up
See what's waiting to be won, what has stalled, and how often your proposals land.
- →Group unbilled proposals by status and stay on top of your proposal pipeline.
- →Track the age of your active proposals, so stale fees stand out.
- →Monitor your win rate month by month, by number of proposals and by value.
Take your data further, your way
The dashboard covers the everyday view. When you need something bespoke, your data goes where you work.
Google Sheets
Use the Socket Google Sheets extension for client-by-service matrices and spreadsheet-based reports.
Socket API
Build your own reports and connections with the open Socket API.
Socket MCP
Ask Claude, ChatGPT, or Gemini about your fees and clients through Socket MCP.
What practices say
"Pricing only works if you can see what's happening once proposals go out. Socket's new dashboard gives us a clear view of fees and performance by partner and portfolio, on demand, instead of a manual exercise we'd run monthly."
Dan Johnson, Nuvo Accountancy
Run the practice on numbers you can trust
Because Insights reads straight from your proposals and billing plans, the figures are always current and always consistent with what your clients have agreed. Insights is part of the Pro Features add-on. Want the detail on every chart? Read the Insights guide.
Know where the practice stands, any day of the month.
Start your free trialReady to power up?
Intrigued, but not quite ready?
Join our mailing list
We'll keep you updated with news on exciting product launches and upcoming webinars.